
Speed up your app 研读(一)
本文对Speed up your app进行翻译并研究 下面的翻译只对关键部分进行翻译。原文请参照 http://blog.udinic.com/2015/09/15/speed-up-your-app。
一、优化规则
1.永远使用数据而不是靠感觉来衡量
2.使用低端机型进行测试
3.明确有得必有失,在完成性能优化时,必定需要花费其他样的东西。比如空间
二、Systrace
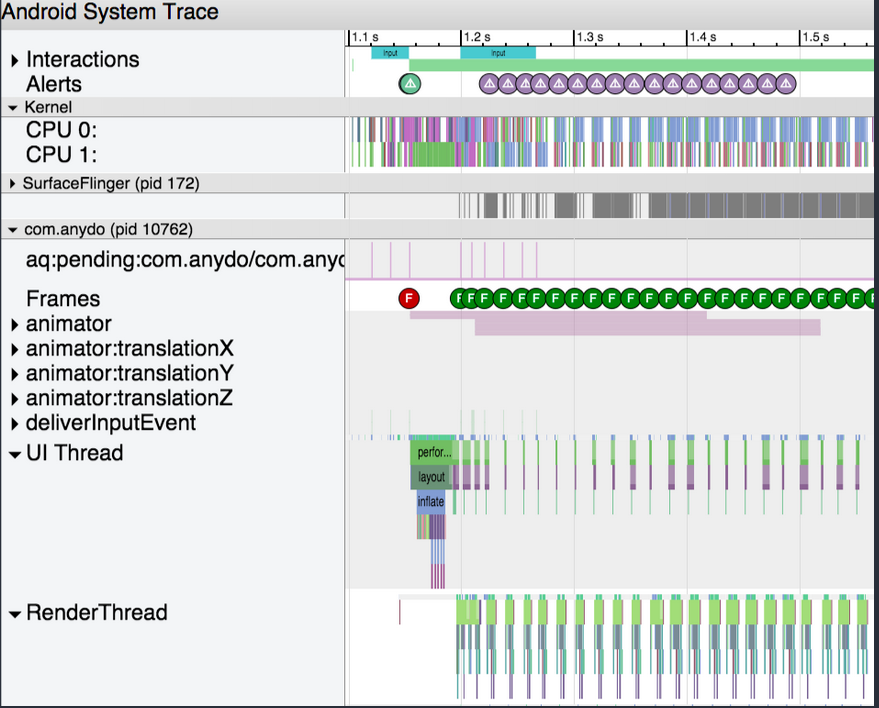
Systrace是很多程序员不会用的工具,因为其中有很多看不懂的信息,让我们先看看他长什么样子
我们可以通过Android Device Monitor tool 或者命令行进行生成,我们可以在这里发现更多信息。http://developer.android.com/tools/help/systrace.html
在Android Device Monitor tool中点击  倒数第二个图标就可以启动
注意图上绿色 黄色 红色的颜色区分,红色代表性能出现了问题
当我们点击该frame的时候
我们可以看到所花费的时间为32ms,超过了frame render的16ms时间。同时,我们可以看到下面各个函数所花费的时间。以此,我们可以发现性能所在的问题
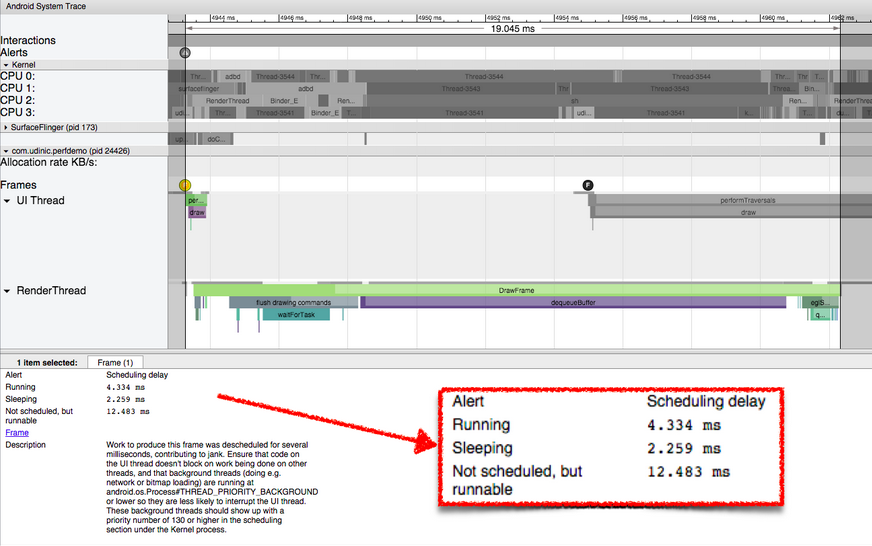
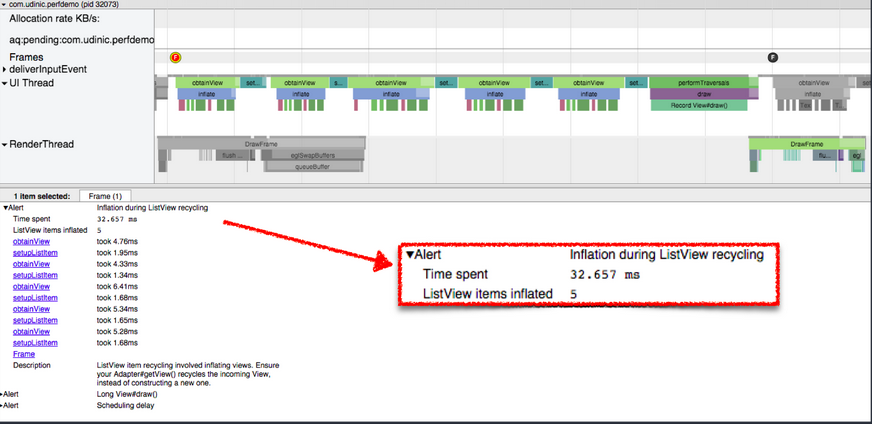
当选择了某个frame的时候,我们可以通过点击m键来查看具体信息,有以下几个信息需要注意
Scheduling delay:定时延迟
A Scheduling delay means that the thread, processing that specific slice, was not scheduled on the CPU for a long time. Therefore, it took longer for this thread to complete. Selecting the longest slice in the frame shows more specific information
Wall duration:任务开始到结束的时间
The Wall duration is the time passed from the moment that slice started until finished. It’s called “Wall duration”, because it’s like looking at a wall clock since the thread has started.
CPU duration:cpu在这个任务上实际花费的时间
The CPU duration is the actual time the CPU spent processing that slice.
一般来说cpu花费时间要小于wall duration
但是如果我们想要得知是什么使得cpu如此繁忙,我们需要使用traceview
三、Traceview
查看每个方法花费时间的工具 http://developer.android.com/tools/debugging/debugging-tracing.html
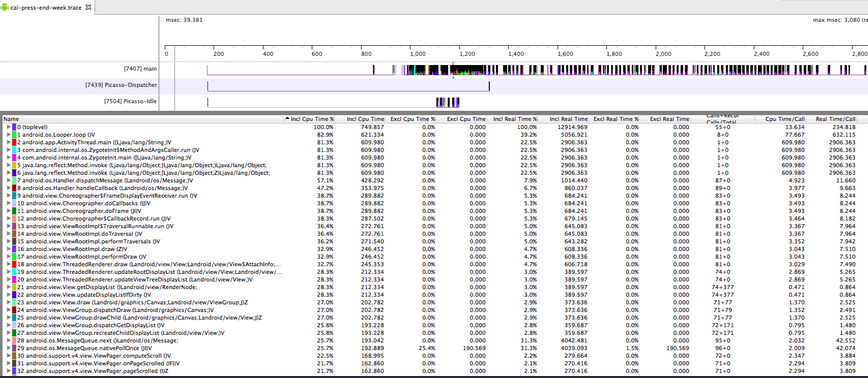
注意其中有如下属性
Name - The name of the method, along with a color to identify it on the graph above.
Inclusive CPU Time - The time it took the CPU to process that method and its children (i.e. all the methods it called).
Exclusive CPU Time - The time it took the CPU to process that method alone.
Inclusive / Exclusive Real Time - The time that has passed from the moment the method started until completed. Same as “Wall duration” on Systrace.
Calls+Recursion - How many times this method was called, and the amount of recursive calls too.
CPU/Real time per Call - The CPU/Real time it took per call to this method, on average. The other time fields are showing the aggregated time of all calls to a method.
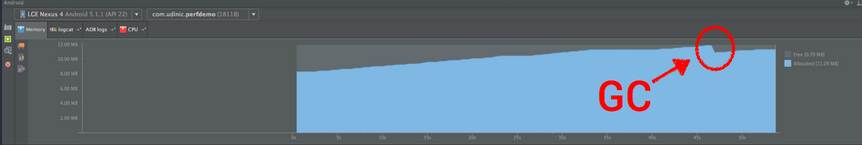
四、Memory Profiling
注意如果图片上存在如下图的向下趋势,则代表是发生了GC
五、Heap dump
主要进行内存泄露的分析
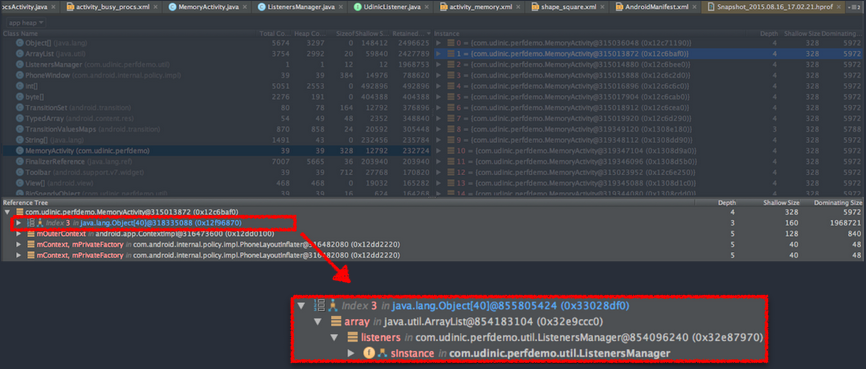
同样类似的工具还有LeakCanary
六、Allocation Tracker
根据以上信息,我们可以发现分配太多内存并且可能引起很多GC事件的方法,我们同时也可以发现同一个类的许多短生命周期的实例,针对这个情况,我们可以考虑使用Object pool来减少分配
![]()
![]()
七、一些优化内存的提示
1.当我们讨论性能问题时,枚举通常是不变的话题。枚举会比普通常量更占内存吗?答案是肯定的,但是这是不好的吗?未必。如果你需要强类型带来的安全性,那么就应该使用枚举,而如果你一些可以归类的常量,那么应该使用枚举。
2.自动装箱。自动从原生类型转换到对象,比如int到integer,我们应该避免频繁的自动装箱。
3.HashMap和ArrayMap/SparseArray,和上面第二天一样,HashMap使用对象作为keys,如果我们使用原生int作为关键字,那么他就会自动转换为integer。我们可以考虑使用ArrayMap和SparseArray。性能会更好。
4.时刻关注context,我们往往会在activity中引用context,并且我们需要关注context引用是否被清理,如果未被清理,则会导致activity销毁以后,对象仍然还是存活的。导致了内存泄露。
5.避免非静止的内部类。首先,非静止的内部类在实例化的时候会保有外部类的引用,如果你需要内部类,但是不需要外部类了,就会导致外部类仍然存在于内存中。比如说你在activity中创造一个继承与AsyncTask的非静止内部类,并且执行该异步操作,当我们销毁activity的时候,异步任务仍然会让该activity存活。